INTRODUCTION
The widespread use of antibiotics in human medicine, veterinary practices, and agriculture has led to their increasing presence in aquatic environments worldwide [1,2]. These pharmaceutical compounds enter water bodies through various pathways, including wastewater discharge from hospitals and pharmaceutical industries, agricultural runoff, and improper disposal of unused medications [3,4]. Conventional wastewater treatment plants are often ineffective in removing these persistent organic pollutants, resulting in their accumulation in surface water, groundwater, and even drinking water sources [4,2].
The presence of antibiotics in the environment poses significant risks to both human health and ecosystems, as low concentrations can promote the development and spread of antibiotic-resistant bacteria [1,3]. Additionally, antibiotics can have toxic effects on aquatic organisms and disrupt natural microbial communities, potentially affecting ecosystem balance [2,4]. These concerns emphasize the urgent need for effective strategies to prevent and control antibiotic contamination in water systems [1,4].
Among various water treatment technologies, adsorption has emerged as one of the most promising and cost-effective methods for removing organic pollutants, including antibiotics, from aqueous solutions [1,2]. Activated carbon, in particular, has been widely recognized for its exceptional adsorption capacity due to its high surface area, well-developed pore structure, and surface chemistry that can be tailored for specific applications [4,3]. However, the high cost of commercial activated carbon, typically derived from non-renewable sources such as coal or petroleum-based materials, limits its widespread application, especially in developing countries [1,4].
In recent years, there has been growing interest in developing activated carbon from renewable and low-cost biomass precursors, particularly agricultural waste materials [1,5]. This approach offers multiple advantages: it provides a sustainable solution for waste management, reduces the dependency on fossil resources, and creates value-added products from materials that would otherwise be discarded or burned [6,5]. Various agricultural residues, including rice husks, coconut shells, corn cobs, and sugarcane bagasse, have been successfully converted into effective adsorbents for water treatment applications [1,5].
Cassava (Manihot esculenta Crantz) is one of the most important staple crops in tropical and subtropical regions, particularly in Southeast Asia, Africa, and South America [7]. Indonesia is among the world's largest cassava producers, with extensive cultivation primarily for food and industrial starch production [7]. However, cassava processing generates significant amounts of agricultural waste, including stems, leaves, and peels, which are often underutilized or disposed of through open burning, contributing to environmental pollution [8,9,10]. Cassava stems, in particular, represent a substantial portion of the biomass waste, containing high cellulose and hemicellulose content that makes them suitable as a precursor for carbonaceous materials [7,11].
The conversion of cassava stem waste into activated carbon through hydrothermal carbonization followed by thermal activation presents a sustainable approach that addresses both waste management and water treatment challenges. Hydrothermal carbonization (HTC) is a thermochemical process that converts biomass into hydrochar under moderate temperatures (180–250 °C) and autogenous pressure, offering advantages such as low energy requirements, ability to process wet biomass without pre-drying, and production of materials with favorable surface properties [7,6]. Subsequent thermal activation can further enhance the textural properties and surface chemistry of the hydrochar, resulting in activated carbon with superior adsorption performance [1,5].
MATERIALS AND METHODS
Materials
Fresh cassava stems (Manihot esculenta; CS) were obtained from a local farm in Way Hui Villages, South Lampung, Indonesia, after the harvesting period. The CS were thoroughly washed with tap water to remove soil and debris, followed by rinsing with distilled water. The cleaned stems were cut into small pieces (approximately 2 cm length) and dried in a drying oven at 100 °C until constant weight was achieved. The dried CS were ground using a laboratory grinder and sieved through 60 mesh to obtain uniform particle size. The prepared CS powder was stored in an airtight container at room temperature until further use.
Materials Preparation
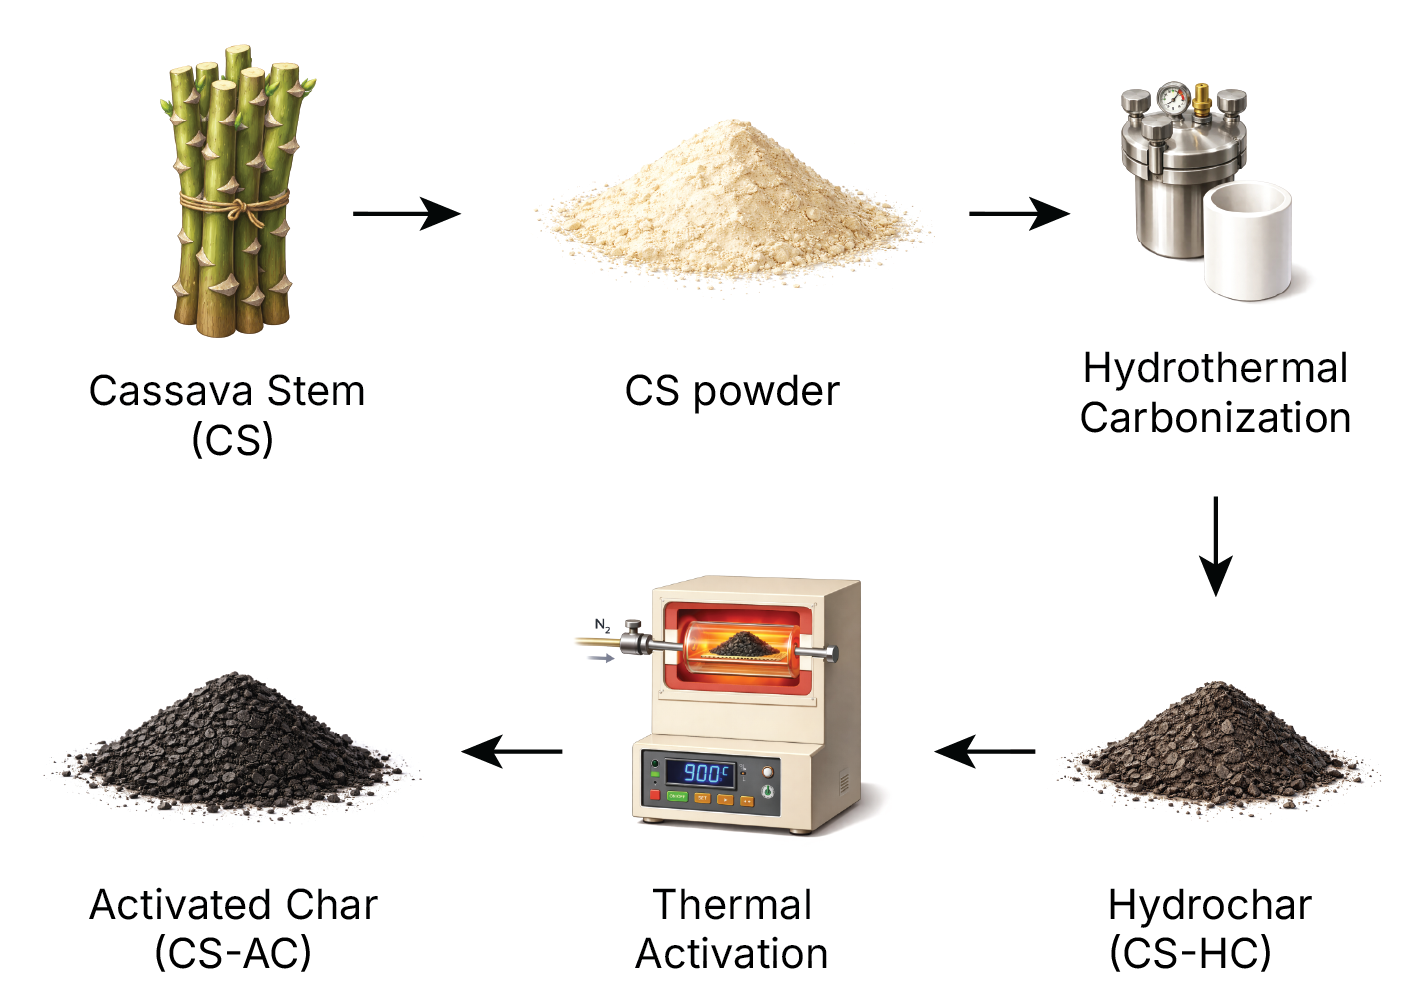
The CS hydrochar (CS-HC) was prepared by hydrothermal carbonization (HTC) of the pretreated CS powder. In a typical procedure, 1 g of CS powder was mixed with 70 mL of distilled water at a solid-to-liquid ratio of 1:70 (w/v). The mixture was transferred into a Teflon-lined stainless steel autoclave reactor with a capacity of 100 mL. The sealed autoclave was heated in an oven at 175 °C for 24 h under autogenous pressure. After the reaction, the autoclave was cooled naturally to room temperature. The resulting solid product was separated by vacuum filtration, washed repeatedly with distilled water until the pH of the washing solution reached neutral, and then dried in an oven at 105 °C for 12 h. The obtained hydrochar was designated as CS-HC. The yield of the CS-HC was calculated using Equation (1):
where WHC is the weight of dried CS-HC (g) and WCS is the weight of initial dry CS (g).
Figure 1. The schematic illustration of the preparation of cassava stem hydrochar (CS-HC) and activated hydrochar (CS-AHC).
The activated hydrochar was prepared through thermal activation of CS-HC under an inert atmosphere (N2). In a typical procedure, 1 g of CS-HC was placed in a ceramic crucible and inserted into a tubular furnace. The furnace was heated to 600 °C at a heating rate of 10 °C/min under continuous flow of nitrogen gas (0.5 L/min) to create an inert atmosphere and prevent oxidation. The sample was maintained at the target temperature for 2 h to ensure complete activation. After the activation, the furnace was cooled naturally to room temperature under nitrogen flow.
The resulting activated hydrochar was collected, washed with distilled water to remove any residual ash, and dried in an oven at 105 °C for 8 h. The obtained activated hydrochar was designated as CS-AHC. The yield of CS-AHC was calculated based on the mass ratio of the final product to the initial CS-HC. The overall preparation procedure of CS-HC and CS-AHC is illustrated schematically in Figure 1.
Materials Characterization
The crystalline structure of the samples was analyzed by X-ray diffraction (XRD) using Rigaku Smartlab SE diffractometer with Cu Kα radiation (λ = 1.5406 Å). The XRD patterns were recorded in the 2θ range of 5–80° with a step size of 0.02° and scanning rate of 2°/min. Fourier Transform Infrared (FTIR) spectroscopy was performed using a Shimadzu IRPrestige-21 spectrometer to identify the functional groups present on the surface of the materials. The spectra were recorded in the wavenumber range of 400–4000 cm−1 with a resolution of 4 cm−1 using ATR mode. Raman spectroscopy was conducted using a Renishaw inVia spectrometer equipped with a 532 nm laser excitation source. The spectra were collected in the range of 400–2000 cm−1 to investigate the carbon structure and degree of graphitization of the materials.
The surface morphology and elemental composition of the samples were examined by scanning electron microscopy coupled with energy-dispersive X-ray spectroscopy (SEM-EDS) using a Hitachi SU3500 microscope operated at an accelerating voltage of 15 kV. Prior to analysis, the samples were gold-coated using a sputter coater to enhance conductivity. The EDS analysis was performed to determine the elemental distribution on the surface of the materials.
Adsorption Performance Test
Batch adsorption experiments were conducted to evaluate the removal performance of tetracycline (TC) by CS-AHC from aqueous solution. A stock TC solution was first prepared and diluted to the desired initial concentrations of 10, 15, and 20 mg/L. For each experiment, 100 mL of TC solution with a known initial concentration (C0) was placed in a 250 mL jacketed glass reactor equipped with a mechanical stirrer and maintained at a constant temperature. A predetermined mass of adsorbent was added to the solution, and the suspension was agitated at 400 rpm to ensure homogeneous mixing and minimize external mass transfer limitations. A schematic of the batch adsorption reactor connected to the UV–Vis spectrophotometer for real-time concentration detection is shown in Figure 2.
Figure 2. Schematic illustration of the batch adsorption reactor coupled to the UV–Vis spectrophotometer for real-time concentration monitoring.
The adsorption process was monitored using an in situ UV–Vis spectrophotometric setup operated in continuous-flow mode. At defined time intervals (every 10 min, from 0 to 180 min), a portion of the suspension was withdrawn from the reactor and passed through a microfiltration unit to remove suspended solids before entering the UV–Vis flow cell. The absorbance of the filtrate at the characteristic wavelength of TC was recorded and converted to the corresponding concentration (Ct) using a previously established calibration curve.
The adsorption performance was quantified in terms of removal efficiency (%R) and adsorption capacity (qt, mg/g) at time t, calculated as:
where C0 and Ct (mg/L) are the TC concentrations at the initial time and at time t, respectively, V (L) is the volume of the solution, and m (g) is the mass of the adsorbent.
The adsorption kinetics were evaluated by fitting the experimental qt versus time data to the pseudo-first-order (PFO) [12] and pseudo-second-order (PSO) [13] kinetic models to elucidate the rate-controlling mechanisms. The non-linear and linearized forms of the PFO model are expressed as Equations (4) and (5), respectively:
where qe (mg/g) is the adsorption capacity at equilibrium, qt (mg/g) is the adsorption capacity at time t (min), and k1 (min−1) is the PFO rate constant.
The non-linear and linearized forms of the PSO model are given by Equations (6) and (7), respectively:
where k2 (g mg−1 min−1) is the PSO rate constant.
RESULTS AND DISCUSSION
Materials Characterization
X-ray diffraction analysis was performed to investigate the crystalline structure and phase composition of the prepared materials. The XRD patterns of CS, CS-HC, and CS-AHC are presented in Figure 3a. The diffraction patterns provide insights into the degree of crystallinity, presence of mineral phases, and structural transformations that occur during the hydrothermal carbonization and activation processes.
Figure 3. (a) X-ray diffraction patterns and (b) FTIR spectra of cassava stem hydrochar (CS-HC) and activated hydrochar (CS-AHC).
For the original CS, the XRD pattern shows relatively strong and broadened peaks, which are typical of cellulose-rich biomass. The broad features around the cellulose-I reflections (commonly near 2θ ∼14–16° and ∼22–23°) indicate a semi-crystalline cellulose framework mixed with amorphous components such as hemicellulose and lignin, consistent with reported cellulose I patterns in biomass-derived fibers and nanocellulose [14,15,16]. In general, biomass-derived carbonaceous materials exhibit broad diffraction humps, reflecting predominantly amorphous or poorly crystalline structures. Any sharp, well-defined peaks would suggest crystalline mineral phases (e.g., inorganic salts or metal oxides) inherited from the precursor or formed during carbonization.
Figure 4. Raman spectra of cassava stem hydrochar (CS-HC) and activated hydrochar (CS-AHC).
Figure 5. SEM images and EDS elemental analysis of cassava stem hydrochar (CS-HC) and activated hydrochar (CS-AHC).
Compared with the raw CS, the CS-HC pattern shows a clear attenuation and broadening of the cellulose-I reflections, indicating partial breakdown of the ordered cellulose domains during HTC and a concurrent increase in the amorphous carbon fraction. In CS-AHC, these cellulose-related features become further suppressed, while a broader diffuse background becomes more prominent, suggesting a more disordered/turbostratic carbon structure after thermal activation. Overall, the progressive loss of crystallinity from CS to CS-HC and CS-AHC is consistent with dehydration, depolymerization, and aromatization during HTC and subsequent activation, which is commonly reported for biomass-derived hydrochars [6].
From a mechanistic perspective, hydrothermal treatment of cellulose is generally described as a sequence of hydrolysis, dehydration, and condensation steps. Water and heat promote cleavage of beta-1,4-glycosidic bonds to produce soluble oligosaccharides and glucose. These sugars can dehydrate to intermediates such as 5-hydroxymethylfurfural (5-HMF), which then undergo rehydration to organic acids (e.g., levulinic and formic acids) and/or polycondensation to form humin-like structures that contribute to hydrochar formation. In parallel, a solid-state pathway involving dehydration and aromatization of the cellulose backbone can also yield carbonaceous solids. These pathways explain the diminished cellulose crystallinity and the emergence of a more amorphous carbon background in CS-HC and especially CS-AHC under HTC and activation conditions [17,18,19].
Fourier Transform Infrared spectroscopy was employed to identify the functional groups present on the surface of the prepared materials, and the spectra are shown in Figure 3b. The main bands are assigned to O–H stretching (3200–3600 cm−1), aliphatic C–H stretching (2800–3000 cm−1), C=O stretching (1600–1750 cm−1), C–O stretching (1000–1300 cm−1), and aromatic C=C stretching (1500–1600 cm−1) [20,21]. The raw CS shows a strong and broad O–H band and pronounced polysaccharide-related C–O bands (1000–1200 cm−1), consistent with cellulose-rich biomass. After hydrothermal carbonization (CS-HC), these hydroxyl and C–O features weaken, indicating dehydration and cleavage of glycosidic/ether linkages. The CS-AHC spectrum shows a further attenuation of the O–H and aliphatic C–H bands, while bands in the carbonyl/aromatic region (around 1600–1700 cm−1) become relatively more evident, suggesting the formation of more condensed/aromatic structures and oxygenated surface groups after activation [20,22,17]. These changes in functional group composition are consistent with the progressive carbonization/activation and are relevant to adsorption behavior.
Raman spectroscopy was employed to investigate the carbon structure and degree of graphitization of the prepared materials, and the spectra of CS-HC and CS-AHC are shown in Figure 4. Both spectra exhibit the characteristic D-band (disorder) around 1350 cm−1 and G-band (graphitic) around 1580 cm−1. The D-band is associated with defects, disordered carbon, and sp3-hybridized domains, whereas the G-band corresponds to the in-plane vibration of sp2-hybridized carbon in graphitic domains [23]. In panel (a) (CS-HC), the G-band is more dominant relative to the D-band, indicating a higher fraction of ordered sp2 domains. In panel (b) (CS-AHC), the D-band becomes comparatively stronger and broader, suggesting a higher defect density and a more disordered/turbostratic structure after activation [24]. Accordingly, the ID/IG ratio provides a concise indicator of structural order: a lower ratio implies higher graphitization and structural order, while a higher ratio reflects a more defective or amorphous carbon network.
Scanning electron microscopy was employed to examine the surface morphology and microstructure of the prepared materials. The SEM images of CS-HC and CS-AHC are presented in Figure 5. CS-HC retains the elongated, channel-like pores of the cassava stem matrix, with relatively smooth pore walls at higher magnification. After activation, CS-AHC shows enlarged and more open pore mouths, rougher surfaces, and fragmented debris on the pore walls, indicating pore widening and etching during thermal activation [22]. These changes are expected to increase accessible surface area and improve mass transfer to adsorption sites.
Energy-dispersive X-ray spectroscopy (EDS) mapping confirms that both samples are predominantly composed of carbon and oxygen with a relatively uniform spatial distribution across the observed areas [25,26]. Quantitative EDS analysis gives the composition of CS-HC as 71.34 wt.% C and 28.66 wt.% O (uncertainties 3.12 and 9.20 wt.%, respectively), and that of CS-AHC as 80.21 wt.% C and 19.79 wt.% O (uncertainties 2.70 and 10.45 wt.%, respectively). Thus, activation increased the carbon content by approximately 9 percentage points (from 71 to 80 wt.%) and decreased the oxygen content by a similar margin (from 29 to 20 wt.%), consistent with progressive carbonization and partial deoxygenation during thermal activation [27]. Together, the SEM-EDS results support the development of a more porous and carbon-rich surface in CS-AHC, which is favorable for adsorption.
Adsorption Performance
The adsorption performance of CS-AHC was evaluated as a function of contact time for three adsorbent doses (10, 15, and 20 mg). Figure 6(A) shows the adsorption capacity curves for the three doses. It can be obtained that the uptake increased rapidly at the initial stage, followed by a gradual approach to equilibrium, indicating progressive occupation of available adsorption sites. The highest uptake per mass of adsorbent (12.102 mg/g) was observed at the lowest dose (10 mg), which is consistent with a higher adsorbate-to-adsorbent ratio and more effective utilization of surface sites.
To contextualize the adsorption performance of CS-AHC, a comparison with literature data on tetracycline (TC) adsorption by various carbon-based adsorbents is presented in Table 2. The maximum adsorption capacity of CS-AHC in this study (12.1 mg/g) falls within the range reported for unmodified biochars and hydrochars derived from biomass residues (typically 2–50 mg/g), such as rice-husk biochar (20.3 mg/g) [28] and corn-stover biochar (13.9 mg/g) [29]. In contrast, chemically activated carbons prepared using ZnCl2 or other activating agents exhibit substantially higher capacities (200–300+ mg/g), as exemplified by ZnCl2-activated poplar-sawdust biochar (269.5 mg/g) [30] and ZnCl2-activated sugarcane-bagasse carbon (239.6 mg/g) [31]. However, these high-performance adsorbents require additional chemical reagents and multi-step processing, which increase production cost and environmental burden. The CS-AHC prepared in this study, by contrast, was obtained through a simple hydrothermal carbonization followed by thermal activation without chemical activating agents, making it a cost-effective and environmentally benign alternative. Thus, CS-AHC is competitive within the category of low-cost, biomass-derived adsorbents produced without chemical activation, and its performance can be attributed to the porous structure and oxygen-containing surface functional groups that facilitate interactions with TC molecules through hydrogen bonding, π–π stacking, and electrostatic attraction.
Figure 6. Kinetic plots for CS-AHC: (A) experimental data with non-linear PFO/PSO fits, (B) linearized PFO model, and (C) linearized PSO model.
Kinetic behavior was analyzed using both pseudo-first-order (PFO) and pseudo-second-order (PSO) models in non-linear and linearized forms (Figure 6). The PFO and PSO models are expressed as:
where qt (mg/g) is the adsorption capacity at time t, qe (mg/g) is the equilibrium capacity, and k1 (min−1) and k2 (g mg−1 min−1) are the PFO and PSO rate constants, respectively.
Specifically, Figure 6(A) shows the experimental uptake curves with non-linear PFO/PSO fits, Figure 6(B) presents the linearized PFO plot, and Figure 6(C) shows the linearized PSO plot. The linear fits provide the kinetic constants and goodness-of-fit values summarized in Table 1. Across the tested doses, the PSO model yields higher R2 values than the PFO model, suggesting that chemisorption or surface reaction steps play a more important role in controlling the uptake rate. The fitted parameters further show that the apparent rate constants increase with adsorbent dose, consistent with faster attainment of equilibrium when more adsorption sites are available.
Similar PSO-dominated kinetics have also been reported for antibiotic adsorption on cassava-stem-derived activated carbon and on activated carbon derived from luffa sponge, where ofloxacin uptake was better described by the PSO model than the PFO model [32,33]. This behavior is commonly interpreted as indicating that surface reaction steps and site-specific interactions are rate-controlling, including electron sharing or exchange, complexation with oxygen-containing functional groups, and electrostatic interactions between the adsorbate and the carbon surface. In the present system, the porous structure and surface functionalities of CS-AHC likely promote these interactions, leading to the higher PSO fit and suggesting that adsorption proceeds through a combination of surface reaction and diffusion to active sites.
| Sample | PFO | PSO | ||||
|---|---|---|---|---|---|---|
| Qe,lin (mg/g) | k1 (min−1) | R 2 | Qe,lin (mg/g) | k2 (g mg−1 min−1) | R 2 | |
| CS-AHC 10 mg | 8.8768 | 0.0165 | 0.9468 | 13.3247 | 0.00285 | 0.9955 |
| CS-AHC 15 mg | 6.8664 | 0.0278 | 0.9951 | 9.4117 | 0.00501 | 0.9988 |
| CS-AHC 20 mg | 7.5082 | 0.0271 | 0.8600 | 8.4306 | 0.00084 | 0.6810 |
| Adsorbent | Precursor | qmax (mg/g) | Conditions | Ref. |
|---|---|---|---|---|
| ZnCl2-activated biochar | Poplar sawdust | 269.5 | pH 5, 25 °C | [30] |
| ZnCl2-activated carbon | Sugarcane bagasse | 239.6 | pH 7, 30 °C | [31] |
| KOH-activated biochar | Pomelo peel | 178.6 | pH 5, 25 °C | [34] |
| ZnCl2-activated carbon | Macadamia nut shell | 131.6 | pH 4, 25 °C | [35] |
| Ca(OH)2-modified biochar | Corn straw | 93.5 | pH 5, 25 °C | [36] |
| Hydrochar | Sewage sludge | 48.2 | pH 7, 25 °C | [37] |
| Biochar | Rice husk | 20.3 | pH 7, 30 °C | [28] |
| Thermal-modified AC | Coconut shell | 13.9 | pH 6, 25 °C | [29] |
| Hydrochar (CS-AHC) | Cassava stem | 12.1 | pH 7, 25 °C | This study |
| Hydrochar-derived AC | Sugarcane bagasse | 11.6 | pH 5.5, 25 °C | [38] |
CONCLUSION
Cassava stem waste was successfully converted into hydrochar (CS-HC) and activated hydrochar (CS-AHC), producing a porous carbonaceous adsorbent suitable for antibiotic removal. Structural analyses (XRD, FTIR, Raman, and SEM-EDS) confirm progressive loss of cellulose crystallinity, formation of more disordered/aromatic carbon domains, and development of rougher, more open pore structures after activation. These changes increase accessible surface area and provide oxygen-containing functional groups that favor adsorption. In batch tests, CS-AHC exhibited rapid uptake and higher adsorption capacity at lower adsorbent dose, while kinetic fitting showed that the pseudo-second-order model better describes the adsorption behavior, indicating the importance of surface interactions. Overall, the results demonstrate that cassava stem-derived activated carbon is a promising, low-cost adsorbent for aqueous antibiotic removal and offers a sustainable route for valorizing agricultural residues.