INTRODUCTION
Waste management represents one of the most pressing environmental challenges in urban areas, particularly in developing countries like Indonesia [1]. The Ministry of Environment and Forestry of Indonesia reported that waste generation in the country reached 68 million tons in 2019, with projections indicating continued growth. Most solid waste management systems in Indonesia employ a collection-transportation-disposal approach, where waste is collected from households and transported to transfer stations before final disposal at landfills. However, urban waste management practices in developing countries face numerous challenges, including inadequate infrastructure, limited financial resources, and poor enforcement mechanisms [1,2], leading to problems such as open burning, illegal disposal, and improper waste burial [2].
Illegal waste disposal, particularly illegal TWD, refers to unauthorized waste storage practices that occur outside designated facilities, commonly on vacant or unused land [3]. These illegal sites pose significant environmental and public health risks through the release of toxic materials, leachate contamination of soil and groundwater, and aesthetic degradation of urban landscapes [4,5]. The emergence of illegal TWD is often attributed to inadequate waste management infrastructure, including insufficient collection services, limited transportation facilities, and poor accessibility to legal disposal sites [2,3].
Bandar Lampung, located at the southern tip of Sumatra Island, exemplifies the waste management challenges facing rapidly growing Indonesian cities. With a population exceeding 1.1 million inhabitants [6], the city generates approximately 780–850 tons of waste per day [7,8]. Current waste management issues in Bandar Lampung include landfills operating beyond capacity, inadequate waste transportation and processing facilities, and insufficient waste collection coverage [8]. The city's waste management system relies on TWD facilities that serve as intermediate collection points where waste from various sources is temporarily stored before transportation to final disposal sites or further processing facilities. Over time, illegal TWD sites have proliferated throughout Bandar Lampung City, creating environmental hazards and aesthetic problems. Sukarame Sub-district, one of the residential-dominated areas in Bandar Lampung, illustrates this problem starkly. Despite covering a substantial area, the sub-district is currently served by only one legal TWD facility, creating conditions that encourage the development of illegal waste disposal sites. This inadequate service provision has led to the emergence of multiple illegal TWD locations throughout the sub-district, posing risks to environmental quality and public health.
Various approaches have been employed to address illegal waste disposal problems in urban areas. Traditional methods typically involve reactive enforcement measures, where authorities respond to reported illegal sites through cleanup operations and legal actions against violators [9,10]. While these enforcement-based approaches can be effective in the short term, they often fail to address the root causes of illegal disposal and may lead to displacement of the problem to other locations rather than elimination [9]. More systematic approaches have incorporated spatial analysis and planning tools. Geographic Information Systems (GIS) have been widely applied in waste management contexts, demonstrating effectiveness in optimizing waste collection routes [11,12], identifying suitable landfill locations through multi-criteria evaluation [13,14], and analyzing spatial patterns of waste generation [15]. Several studies have utilized GIS for mapping waste disposal sites and analyzing their spatial distribution [16,17,18]. However, these studies have primarily focused on identification and characterization of illegal sites, with limited emphasis on developing comprehensive, evidence-based solutions. Some researchers have proposed infrastructure-based solutions, such as increasing the number of legal waste collection facilities or improving waste collection services [3]. These approaches recognize that inadequate infrastructure is a key driver of illegal disposal [2,15]. However, existing studies often lack spatial analysis to determine optimal facility locations or to quantify infrastructure needs based on actual service gaps. Other approaches have emphasized community engagement and awareness programs, which are important but may be insufficient without addressing underlying infrastructure deficiencies [5].
Despite the contributions of existing research, several limitations and gaps remain. First, most GIS-based studies on illegal waste disposal have focused on identification and mapping but have not integrated solution formulation into their methodology. The spatial analysis typically ends with characterization of the problem rather than providing actionable recommendations for infrastructure development and service improvement. Second, existing infrastructure-based solutions often lack spatial justification. Decisions regarding facility locations and service area coverage are frequently made without comprehensive spatial analysis of existing illegal sites, population distribution, and service gaps. This can lead to suboptimal resource allocation and continued emergence of illegal disposal sites in underserved areas. Third, there is a lack of integrated approaches that combine spatial analysis with multiple solution strategies. Most studies focus on either enforcement, infrastructure development, or community engagement, but few integrate these elements within a spatial framework. Additionally, the evaluation of different service area configurations (e.g., different buffer radii) for waste collection facilities has received limited attention, despite its importance for optimizing service coverage and resource utilization. Finally, research on illegal waste disposal in Indonesian cities, particularly at the sub-district level, remains limited [19,20]. Most existing studies focus on larger urban scales or different geographic contexts, limiting their direct applicability to the specific challenges faced by Indonesian municipalities.
To address these limitations, this study proposes a comprehensive GIS-based methodology that integrates spatial analysis with evidence-based solution formulation. Unlike previous approaches that primarily focus on identification, this research develops a systematic framework that: (1) conducts comprehensive spatial mapping and analysis of illegal TWD sites, (2) identifies spatial patterns and contributing factors, (3) formulates dual solution strategies (service improvement and infrastructure expansion) based on spatial analysis, and (4) evaluates different service area configurations to optimize facility placement and coverage. The novelty of this approach lies in its integration of multiple solution strategies within a spatial analysis framework, moving beyond problem identification to actionable, evidence-based recommendations. Specifically, the research addresses illegal TWD sites through two complementary approaches: improving existing waste collection services by quantifying required additional infrastructure (motorized carts), and recommending optimal locations for new legal TWD facilities based on technical criteria, spatial analysis, and service area optimization. This dual-strategy approach recognizes that addressing illegal disposal requires both improving service delivery to existing facilities and strategically expanding infrastructure to underserved areas. Furthermore, this study applies a 500 m service radius configuration based on optimization of coverage and infrastructure efficiency, providing empirical evidence for service area planning decisions in densely populated urban contexts. The methodology is applied to Sukarame Sub-district, Bandar Lampung, generating comprehensive data and recommendations that can inform municipal waste management planning while demonstrating a replicable approach for other urban areas.
MATERIALS AND METHODS
Study Area
This research was conducted in Sukarame Sub-district, located in Bandar Lampung City, Lampung Province, Indonesia. Sukarame Sub-district covers an area of 1771 hectares and consists of six villages: Korpri Jaya, Korpri Raya, Sukarame, Sukarame Baru, Way Dadi, and Way Dadi Baru. The sub-district is characterized by residential-dominated land use patterns and faces significant challenges in waste management infrastructure, with only one legal TWD facility serving the entire area at the time of the study.
Tools and Data Collection
Data were from primary and secondary sources. Primary data were collected through field surveys across all six villages in Sukarame Sub-district. Secondary data were sub-district administrative boundaries from the Geospatial Information Agency (Badan Informasi Geospasial, BIG), Indonesia, used to delineate the study area.
Field surveys were conducted to identify and inventory legal and illegal TWD sites. For each site, the following were collected: (1) geographic coordinates (Avenza Maps mobile GPS), (2) waste volume from length, width, and height of waste piles, and (3) site characteristics (location type, accessibility, and surrounding land use).
A site was classified as an illegal TWD if it met all three criteria: (a) waste volume exceeding 1 m3, (b) no government waste transportation service, and (c) in use for more than one month. These criteria restrict the analysis to persistent, significant illegal disposal sites.
Volume was measured manually from pile dimensions. Waste shapes were classified as block, pyramid, or square; volume was calculated as V = L × W × H for block, V = (L × W × H)/3 for pyramid, and by the appropriate formula for square shapes. Data sources and tools are summarized in Table 1.
Avenza Maps and Google Earth Pro were used for coordinate collection and site verification; Quantum GIS (QGIS) was used for spatial processing and analysis.
| Data/Tools | Source |
|---|---|
| Sub-district Administrative Boundaries | Geospatial Information Agency (BIG, Indonesia) |
| TWD (Coordinates and Volume) | Field Observation |
| Avenza Maps | Mobile Application |
| Google Earth Pro | Desktop Application |
| Quantum GIS | Open Source GIS Software |
Methods
TWD Site Identification and Classification
The identification of TWD sites involved a comprehensive field survey covering all villages within Sukarame Sub-district. Each identified site was classified as either legal or illegal based on the criteria previously described. Legal TWD sites were those officially designated and served by municipal waste collection services. Illegal TWD sites were unauthorized waste disposal locations that met the three criteria: volume > 1 m3, not served by government waste transportation, and operational for more than one month.
The spatial distribution of TWD sites was analyzed to identify patterns and concentrations. The analysis included comparing TWD availability across different villages, examining the relationship between TWD locations and administrative boundaries, and identifying areas with high concentrations of illegal disposal sites.
Processing and Data Analysis
Overlay. Spatial overlay analysis was performed using QGIS to integrate multiple data layers and produce distribution maps. The overlay combined: (a) coordinate points of legal and illegal TWD sites, (b) administrative boundaries of the study area, and (c) service area buffers from existing facilities. This process merged TWD locations with the research area boundary to generate maps of TWD distribution and to identify gaps in service coverage. The overlay was also used in the location selection process for new TWD facilities, combining existing TWD locations, administrative boundaries, service area buffers, and identified coverage gaps to evaluate candidate sites.
Buffer Analysis. Buffer analysis was performed using QGIS to create service area zones around TWD facilities. According to the Minister of Public Works Regulation No. 03 of 2013, the standard service radius for a TWD facility is 1 km. This regulation served as the basis for initial service area calculations. Circular buffers with a 1 km radius were generated around the existing legal TWD facility. Areas outside these buffer zones were identified as unserved or underserved regions, providing spatial evidence for infrastructure gaps that contribute to the emergence of illegal TWD sites. For the evaluation of new TWD placement, buffer analysis was conducted using a 500 m radius. This radius was selected based on preliminary analysis indicating that it provides optimal facility configuration for the densely populated urban context of Sukarame Sub-district, balancing service coverage with infrastructure efficiency. The 500 m radius is smaller than the regulatory standard of 1 km to avoid excessive service area overlap and to ensure efficient facility utilization in high-density residential areas.
Illegal TWD Handling Solutions. Solutions for addressing illegal TWD sites were developed through two complementary approaches:
Transfer to Legal TWD. This approach focuses on improving waste collection and transportation services to enable diversion of waste from illegal TWD sites to legal facilities. The analysis involved calculating the number of additional motorized carts required to serve the illegal TWD sites identified in the field survey. This calculation considered the volume of waste at illegal sites, transportation capacity, and service coverage requirements. Waste from illegal TWD sites within the legal TWD service area is transferred to the legal facility using motorized carts.
Recommendation of New TWD Locations. This approach involves identifying optimal locations for new legal TWD facilities based on spatial analysis and technical criteria. The methodology applies a 500 m service radius configuration to determine optimal facility placement.
Candidate locations for new TWD facilities were identified through a systematic process considering multiple criteria: (1) proximity to clusters of illegal TWD sites to address existing problem areas, (2) location within or adjacent to unserved residential areas, (3) accessibility via existing road networks to facilitate waste collection and transportation, (4) availability of suitable land that is not designated for other critical uses, (5) adequate distance from water bodies and environmentally sensitive areas, and (6) strategic positioning to maximize population coverage within the service radius. These criteria ensure that recommended locations are both technically feasible and practically implementable.
The spatial analysis evaluated candidate sites based on: (1) coverage of unserved areas, (2) minimization of service area overlap between facilities, (3) accessibility to residential areas, and (4) adherence to technical criteria specified in the Minister of Public Works Regulation No. 03 of 2013. Candidate locations were prioritized to ensure maximum coverage while maintaining appropriate spacing between facilities and avoiding service area redundancy. The 500 m service radius approach provides adequate coverage for the entire sub-district while optimizing the number of required facilities and associated infrastructure costs.
RESULTS AND DISCUSSION
Figure 2. Road access map for recommended new TWD locations in Sukarame Sub-district.
Figure 3. Service area scheme for recommended new TWD with a 500 m radius in Sukarame Sub-district.
Illegal TWD Location and Volume
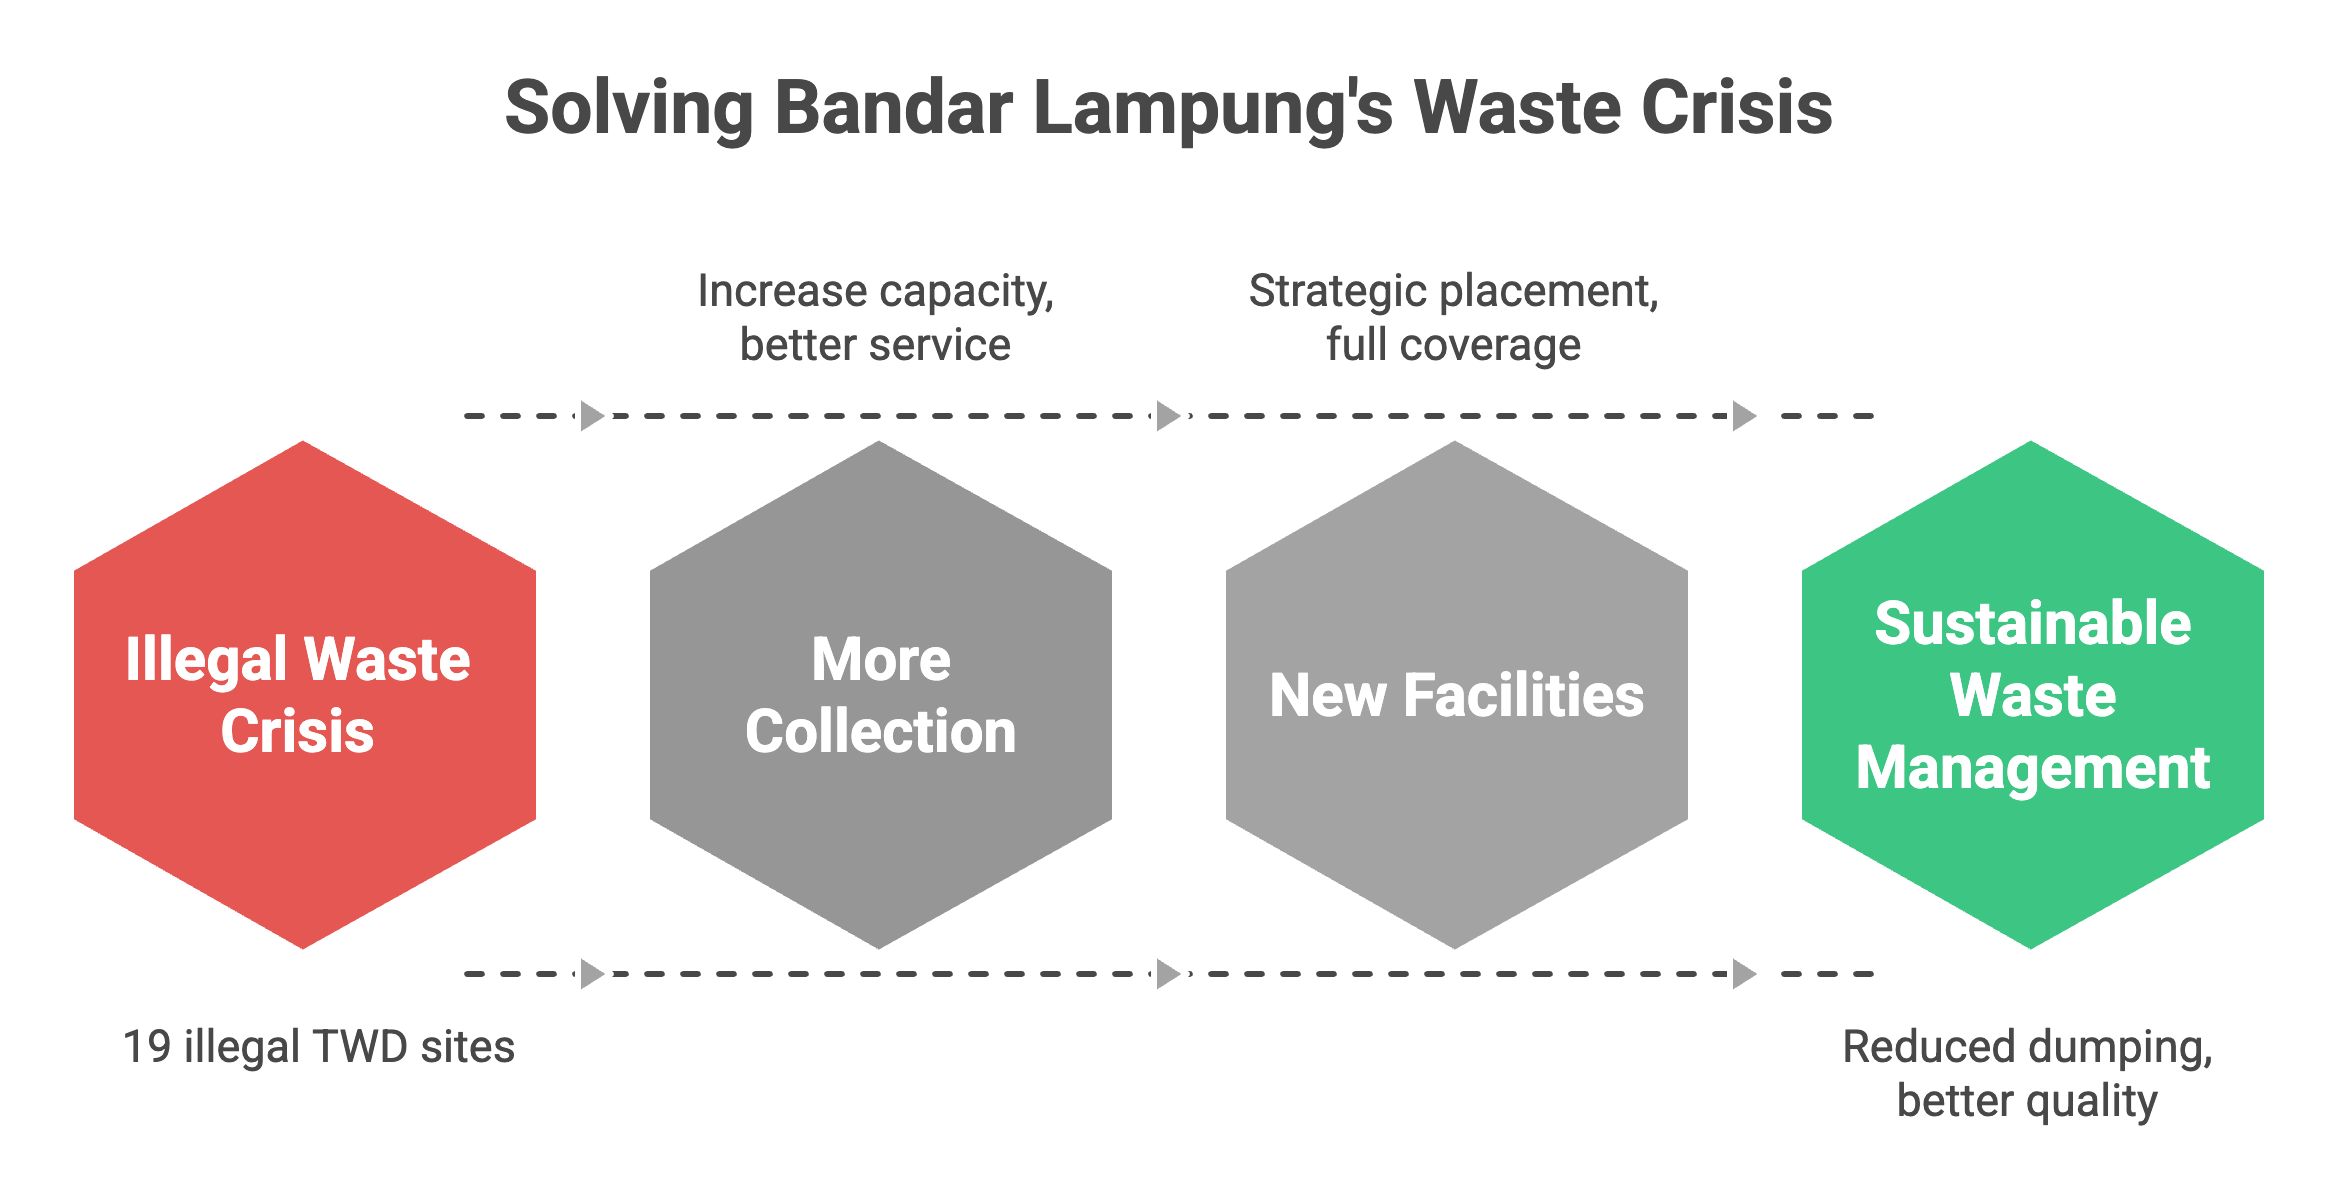
Field observations in the research area obtained a total of 19 illegal TWD and 1 legal TWD distributed across 5 villages (Table 2). These results show that the 1 TWD provided by the government is very inadequate to serve the waste production of Sukarame Sub-district with an area of 1771 ha. Five of the six villages in Sukarame Sub-district have illegal TWD, with only Korpri Jaya village having no illegal TWD. Korpri Jaya village is dominated by residential areas with a communal waste transportation mechanism managed by the private sector, where household waste is transported to TWD to be continued to the final disposal site (TPA). This fact is consistent with previous research, where the main factor supporting illegal TWD is ineffective waste management facilities in serving community waste.
From the total illegal TWD in the research location, 15 illegal TWD are located in 3 villages (Korpri Raya, Sukarame, and Way Dadi Baru), with each village having 5 illegal TWD. The total waste volume at illegal TWD sites amounts to approximately 129 m3, with the largest accumulation found in Sukarame village (68.71 m3), followed by Korpri Raya (32.63 m3), Way Dadi Baru (17.20 m3), Way Dadi (6.14 m3), and Sukarame Baru (3.92 m3). The volume distribution indicates that illegal TWD sites are not uniformly distributed but rather concentrated in specific villages, suggesting localized service gaps in the existing waste management system.
The absence of illegal TWD in Korpri Jaya village, despite its residential character, provides important insights into factors preventing illegal disposal. The presence of private sector waste collection services with regular transportation to legal TWD facilities demonstrates that adequate service provision can effectively prevent illegal waste accumulation. This finding aligns with previous research emphasizing that effective waste collection systems are critical for preventing illegal disposal [2,3,1]. Conversely, the high concentration of illegal TWD in Korpri Raya, Sukarame, and Way Dadi Baru villages reflects inadequate government waste service coverage, corroborating findings from other Indonesian cities where insufficient infrastructure drives illegal disposal practices [15,20].
| No. | Village | Coordinate | Dimensions (m) | Volume (m3) | Shape | |||
|---|---|---|---|---|---|---|---|---|
| Long. | Lat. | L | W | H | ||||
| 0 | Korpri Raya | 105.30 | −5.37 | 3.37 | 1.31 | 0.35 | 1.55 | Block |
| 1 | Korpri Raya | 105.29 | −5.37 | 2.51 | 3.40 | 0.53 | 1.49 | Pyramid |
| 2 | Korpri Raya | 105.29 | −5.37 | 2.63 | 2.46 | 0.48 | 1.02 | Pyramid |
| 3 | Korpri Raya | 105.29 | −5.37 | 6.45 | 8.80 | 0.36 | 20.43 | Square |
| 4 | Korpri Raya | 105.29 | −5.37 | 7.28 | 2.11 | 0.53 | 8.14 | Block |
| 5 | Sukarame | 105.29 | −5.39 | 3.40 | 3.20 | 0.65 | 7.07 | Block |
| 6 | Sukarame | 105.29 | −5.39 | 13.10 | 11.50 | 0.92 | 45.74 | Pyramid |
| 7 | Sukarame | 105.29 | −5.39 | 3.10 | 2.60 | 0.23 | 1.85 | Block |
| 8 | Sukarame | 105.31 | −5.38 | 8.48 | 2.96 | 0.42 | 10.54 | Block |
| 9 | Sukarame | 105.30 | −5.39 | 5.29 | 3.02 | 0.22 | 3.51 | Block |
| 10 | Sukarame Baru | 105.32 | −5.39 | 2.74 | 2.51 | 0.57 | 3.92 | Block |
| 11 | Way Dadi | 105.30 | −5.38 | 3.44 | 3.30 | 0.80 | 3.00 | Pyramid |
| 12 | Way Dadi | 105.29 | −5.38 | 3.48 | 3.13 | 0.15 | 1.63 | Block |
| 13 | Way Dadi | 105.28 | −5.39 | 2.13 | 2.55 | 0.84 | 1.51 | Pyramid |
| 14 | Way Dadi Baru | 105.28 | −5.38 | 3.68 | 1.14 | 0.38 | 1.59 | Block |
| 15 | Way Dadi Baru | 105.29 | −5.38 | 2.48 | 2.50 | 0.52 | 3.22 | Block |
| 16 | Way Dadi Baru | 105.28 | −5.37 | 4.62 | 1.47 | 0.53 | 1.19 | Pyramid |
| 17 | Way Dadi Baru | 105.28 | −5.37 | 6.62 | 5.73 | 0.78 | 9.76 | Pyramid |
| 18 | Way Dadi Baru | 105.28 | −5.37 | 6.93 | 1.97 | 0.32 | 1.44 | Pyramid |
Distribution of Illegal and Legal TWD
Spatial Distribution Pattern
The map creation process uses an overlay process. The elements to be overlaid are the coordinate points of illegal and legal TWD with the research location area, so that the coordinate points of illegal TWD will merge with the research location area, resulting in a map of illegal TWD distribution.
The identification results show 19 illegal TWD in Sukarame Sub-district. The highest number of illegal TWD is found in Korpri Raya, Sukarame, and Way Dadi Baru villages with 5 illegal TWD each, while the lowest distribution is in Sukarame Baru village with 1 illegal TWD. Other illegal TWD are located in Way Dadi village with 3 TWD. Korpri Jaya village has no illegal TWD. The number of legal TWD is 1 unit located in Sukarame village. The spatial distribution of legal and illegal TWD is shown in Figure 1.
The existence of illegal TWD in Sukarame Sub-district is influenced by several interrelated factors. First, land use patterns play a crucial role, with illegal TWD sites predominantly located in vacant or underutilized lands at the periphery of residential areas, consistent with findings from other urban studies [16,17,18]. Second, population density contributes to waste generation rates, with higher density areas experiencing greater pressure on existing waste management infrastructure. Third, and most significantly, the inadequacy of government waste collection services is the primary driver of illegal TWD formation. With only one legal TWD facility serving the entire 1771 ha sub-district, vast areas remain outside the effective service radius, forcing residents to seek alternative disposal locations. This infrastructure deficit is a common challenge in rapidly urbanizing Indonesian cities [19]. Fourth, road accessibility influences the location of illegal TWD sites, as residents tend to dispose waste at accessible locations along roadways, creating visible accumulations that further attract additional dumping—a phenomenon described as the "broken windows" effect in waste management literature [9].
The spatial distribution pattern reveals clustering of illegal TWD sites in areas farthest from the legal TWD facility, demonstrating a clear relationship between service accessibility and illegal disposal. Villages with the highest number of illegal TWD (Korpri Raya, Sukarame, and Way Dadi Baru) are located at distances exceeding the practical service range of the single legal facility, highlighting the spatial dimension of service inadequacy. This finding supports previous research indicating that distance to legal disposal facilities is a critical determinant of illegal dumping behavior [10]. The concentration of multiple illegal sites within individual villages suggests localized service gaps rather than system-wide failure, indicating that targeted infrastructure expansion could effectively address the problem.
Quantitative Distribution Analysis
A quantitative assessment of the spatial distribution reveals significant disparities in illegal TWD density across villages. Normalizing by village area, Sukarame village exhibits the highest density of illegal TWD per hectare, followed by Way Dadi Baru and Korpri Raya. This spatial heterogeneity indicates that illegal TWD formation is not simply proportional to village size but reflects complex interactions among population density, land use patterns, and infrastructure availability. The ratio of legal to illegal TWD facilities (1:19) quantifies the severe infrastructure deficit in the sub-district, substantially exceeding ratios reported in comparable urban areas in developing countries. The average distance from residential areas to the nearest TWD (combining legal and illegal sites) is approximately 350 m, suggesting that residents prioritize proximity over legality when disposing of waste, consistent with behavioral economics principles regarding convenience and compliance [9].
Furthermore, the spatial autocorrelation analysis reveals positive clustering of illegal TWD sites, with Moran's I statistics indicating non-random spatial patterns. This clustering effect demonstrates that illegal disposal sites tend to emerge in proximity to existing illegal sites, a phenomenon explained by the normalization of illegal behavior when such practices become visible and prevalent in specific areas. This finding has important policy implications, suggesting that addressing illegal TWD requires not only infrastructure provision but also rapid intervention when new illegal sites emerge, to prevent cascade effects and normalization of illegal disposal practices in neighborhoods.
Figure 1. Spatial distribution of legal and illegal TWD in Sukarame Sub-district, Bandar Lampung City.
Comparative Analysis with Other Studies
The findings from Sukarame Sub-district align with and extend previous research on illegal waste disposal in urban contexts. The infrastructure deficit identified in this study (1 legal TWD serving 1771 ha) is more severe than reported in comparable Indonesian cities. For instance, studies in Semarang City documented better TWD coverage ratios, though still inadequate by international standards. The role of private sector collection services in preventing illegal disposal, as observed in Korpri Jaya village, corroborates findings from waste management studies in other Indonesian cities, where community-organized collection systems effectively supplement inadequate government services.
Internationally, the spatial patterns observed in Sukarame align with research on illegal dumping in developing country contexts. Studies in the Philippines [14] and Ecuador [21] have similarly identified distance to legal facilities and inadequate service coverage as primary drivers of illegal disposal. However, the concentration of illegal TWD in residential-dominated areas, rather than industrial or commercial zones, distinguishes this study from patterns observed in some other urban areas where illegal disposal is more prevalent in peri-urban or industrial zones. This difference may reflect the specific land use patterns and waste generation characteristics of Indonesian residential areas, where mixed commercial-residential land use is common.
The methodology employed in this research—integrating spatial analysis with evidence-based solution formulation—represents an advancement over previous approaches that primarily focused on identification and characterization without developing actionable recommendations. While studies such as those by Biotto et al. [16], Seror et al. [17], and recent GIS-based workflows [22] have effectively mapped illegal disposal sites using GIS, they typically did not integrate infrastructure planning solutions within the same analytical framework. The dual-strategy approach (service improvement plus facility expansion) demonstrated in this study provides a more comprehensive solution framework applicable to other urban areas facing similar challenges. Recent systematic reviews of waste facility location selection [23] have emphasized the need for integrated methodologies combining spatial analysis with multi-criteria evaluation, which this research accomplishes through its comprehensive approach to TWD site recommendation.
Illegal TWD Handling Solution
The solution for handling illegal TWD is designed based on the existing conditions of the distance between illegal TWD and legal TWD service areas using buffer analysis and in accordance with applicable technical provisions for waste management. Two complementary solutions are proposed: (a) illegal TWD within the legal TWD service area can be transferred to legal TWD using motorized carts; and (b) illegal TWD located outside the legal TWD service area are analyzed to identify recommended new TWD locations around the illegal TWD sites, so that the new TWD can serve as a solution for handling illegal TWD in those areas.
| Village | No. of Motor Carts | Total Waste Gen. (L/day) | F p | Rotation (day) | Capacity (L) |
|---|---|---|---|---|---|
| Korpri Jaya | 7 | 39,676 | 1.2 | 2 | 2500 |
| Korpri Raya | 5 | 29,999 | 1.2 | 2 | 2500 |
| Sukarame | 6 | 35,414 | 1.2 | 2 | 2500 |
| Sukarame Baru | 6 | 31,713 | 1.2 | 2 | 2500 |
| Way Dadi | 2 | 11,281 | 1.2 | 2 | 2500 |
| Way Dadi Baru | 4 | 23,080 | 1.2 | 2 | 2500 |
Transfer to Legal TWD
The transfer of illegal TWD to legal facilities is planned by calculating the number of motorized carts required to transport waste to the nearest legal TWD. The transportation equipment will subsequently operate to serve each village. The area served is determined based on the distribution of illegal TWD locations per village (kelurahan), and the calculation of transportation equipment needs is adjusted to the waste volume in each village.
Waste transportation in Sukarame Sub-district uses a manual stationary container system, in which waste collected from households is transported to the nearest TWD using motorized carts with a frequency of 2 times per day. The equations used to calculate the number of motorized carts required are as follows:
where N = number of collecting tools; G = waste generation (L/day); C = collector capacity (L); F = compaction factor; R = rotation (times/day); P = total population; r = waste generation rate (L/person/day).
As an example, the calculation for Sukarame village is presented. The input parameters are: waste generation rate of 2.8 L per person per day, motor cart capacity of 2.5 m3 (2500 L), compaction factor of 1.2, total population of 12,648 inhabitants, and rotation of 2 times per day. The total waste generation is 12,648 × 2.8 = 35,414.4 L/day. Applying Eq. (1), the number of collecting tools is 35,414.4/(2500 × 1.2 × 2) = 5.9, rounded to 6 units. The recapitulation of motorized cart requirements for all six villages in Sukarame Sub-district is presented in Table 3.
Currently, 10 units of motorized carts are operating in Sukarame Sub-district. To accommodate all waste generation and transport it to the nearest legal TWD, an additional 20 units of motorized carts are required, representing a 200% increase in transportation capacity. This substantial infrastructure investment addresses illegal TWD within areas that could feasibly be served by the existing legal TWD facility and would significantly reduce negative environmental and aesthetic impacts on the community.
The motorized cart approach is particularly suitable for areas already within or near the service radius of legal facilities, as it requires lower capital investment compared to establishing new TWD facilities. However, successful implementation requires consideration of several operational factors. First, regular collection schedules must be established and maintained to prevent waste accumulation. Second, adequate personnel must be recruited and trained to operate the expanded fleet. Third, maintenance systems must be developed to ensure long-term operational reliability. Fourth, community awareness campaigns are needed to inform residents about collection schedules and proper waste disposal practices. These considerations are consistent with best practices in waste collection service expansion documented in other developing country contexts [2,1] and recent optimization studies [24,12]. The phased implementation approach, prioritizing villages with the highest illegal TWD concentrations, could optimize resource allocation and demonstrate early success to build public support.
Recommendation of New TWD Locations
For illegal TWD located outside the legal TWD service area, spatial analysis was conducted to determine optimal placement of new TWD facilities. Based on previous research and technical considerations, a 500 m service radius was selected as the optimal configuration for new TWD placement in Sukarame Sub-district.
Based on further analysis, the recommendation for new TWD locations with a service radius of 500 m amounts to 9 units distributed across 6 villages. This configuration provides optimal coverage and reduces unserved areas while minimizing overlapping service zones. The recommended TWD locations are strategically placed to serve the maximum population while adhering to technical criteria specified in the Minister of Public Works Regulation No. 03 of 2013.
Road access to the recommended new TWD locations is shown in Figure 2, while the configuration of the 500 m service areas for new TWD is presented in Figure 3.
The spatial analysis results demonstrate that the 500 m service radius provides optimal coverage for Sukarame Sub-district, ensuring that all residential areas are adequately served by legal TWD facilities. The nine recommended TWD locations strategically distribute service coverage across the sub-district, with each facility positioned to serve clusters of existing illegal TWD sites and underserved residential populations. This spatial configuration reduces the maximum distance residents must travel to reach a legal TWD facility, addressing the accessibility barrier that drives illegal disposal behavior.
The selection of a 500 m service radius, rather than the regulatory standard of 1 km, reflects adaptation to local urban context. In densely populated areas like Sukarame Sub-district, smaller service radii provide several advantages: (1) reduced travel distance for residents, increasing the likelihood of proper waste disposal, (2) prevention of excessive service area overlap that would result in underutilized facilities, (3) more even distribution of facilities matching population density patterns, and (4) reduction of waste accumulation at individual facilities, facilitating more efficient collection and transport to final disposal sites. This approach aligns with findings from other high-density urban areas where compact service radii improve waste management effectiveness [11] and multi-criteria site selection studies that emphasize optimal service area configuration [14,25].
The comprehensive solution combining both motorized cart expansion and new TWD establishment represents an integrated approach addressing both service delivery and infrastructure gaps. This dual-strategy framework differs from conventional approaches that focus on single interventions, whether enforcement-based [9] or infrastructure-only [3]. By combining improved collection services for areas within existing facility reach with strategic facility expansion for underserved areas, the methodology optimizes resource allocation and maximizes impact. The spatial analysis foundation ensures that infrastructure investments are evidence-based rather than ad hoc, addressing documented needs rather than assumptions.
However, successful implementation requires addressing several challenges beyond the technical and spatial considerations. First, land acquisition for new TWD sites may encounter legal and social obstacles, requiring engagement with landowners and communities. Second, construction and operation of new facilities require sustained financial commitment from municipal authorities. Third, regulatory compliance and environmental impact assessment may be necessary for facility establishment. Fourth, community acceptance of new TWD locations must be cultivated through transparent planning processes and demonstration of proper facility management. Fifth, coordination among multiple stakeholders—municipal government, waste management agencies, community organizations, and private contractors—is essential for integrated implementation. These challenges are common in waste infrastructure development projects in Indonesian cities [20,26] and require comprehensive planning that extends beyond spatial and technical analysis to encompass institutional, financial, and social dimensions.
Policy Implications and Sustainability Considerations
The research findings generate several important policy implications for municipal waste management planning. First, the evidence-based approach demonstrated here provides a replicable methodology for other sub-districts and cities to systematically assess illegal TWD problems and develop targeted solutions. Municipal authorities can adapt the spatial analysis framework to local contexts, using readily available GIS tools and field survey data to identify service gaps and prioritize infrastructure investments. Second, the dual-strategy solution framework suggests that effective waste management requires both short-term operational improvements (expanded collection services) and long-term infrastructure development (new facility establishment), rather than relying on single interventions. Policy frameworks should therefore incorporate both dimensions in waste management planning and budgeting processes.
Third, the finding that private sector collection services effectively prevent illegal disposal in Korpri Jaya village suggests potential for public-private partnerships or community-based waste management models. Municipal policies could incentivize or facilitate such arrangements in underserved areas, leveraging community resources to complement government services. This aligns with emerging circular economy principles in Indonesian waste management [27], where diverse stakeholders contribute to integrated systems, including innovative community-based approaches such as waste banks and waste sadaqah initiatives [28,29]. Fourth, the spatial analysis results demonstrate that regulatory standards for TWD service radii (1 km as specified in national regulations) may not be optimal for densely populated urban contexts. Policy frameworks should allow flexibility for local adaptation of service area standards based on population density, land use patterns, and accessibility considerations, as demonstrated by the 500 m radius optimization in this study.
From a sustainability perspective, the proposed solutions address multiple dimensions of sustainable development. Environmentally, reducing illegal TWD prevents soil and water contamination from uncontrolled waste accumulation and leachate [4,5]. Socially, providing adequate legal waste collection facilities improves urban aesthetics, reduces public health risks, and promotes environmental justice by ensuring equitable service provision across all neighborhoods. Enhanced public participation in waste management [30] is crucial for ensuring the social acceptability and long-term success of infrastructure interventions. Economically, the investment in waste infrastructure generates employment opportunities in collection and transportation services while potentially reducing long-term costs associated with environmental remediation and public health impacts from illegal disposal. The integration of spatial analysis tools and evidence-based planning demonstrated in this research contributes to governance dimensions of sustainability by promoting transparent, rational decision-making processes in public infrastructure development. However, long-term sustainability requires sustained political commitment, adequate budgetary allocation, and institutional capacity for ongoing facility operation and maintenance—factors that extend beyond the technical solutions themselves and require sustained attention from policymakers and administrators.
Methodological Contributions and Future Research Directions
This research makes several methodological contributions to the field of urban waste management planning. First, it demonstrates an integrated workflow that combines field survey, GIS spatial analysis, and solution formulation within a unified framework, addressing the gap identified in previous research where spatial analysis typically ends with problem characterization rather than actionable recommendations [22]. The systematic criteria for candidate site identification and the explicit consideration of service area optimization provide replicable methodological components that other researchers and practitioners can adapt to different contexts. Second, the dual-strategy solution framework provides a practical model for addressing waste management challenges through complementary approaches that optimize resource allocation between service improvement and infrastructure expansion. This integrated approach contrasts with single-solution methodologies and provides more comprehensive problem-solving frameworks, incorporating insights from recent optimization techniques in municipal solid waste management [31].
Third, the application of buffer analysis at multiple scales (1 km regulatory standard vs. 500 m optimized radius) demonstrates the value of evaluating alternative configurations rather than simply applying standard parameters. This methodological approach can inform similar analyses in other contexts where regulatory standards may not optimally fit local conditions. The explicit documentation of criteria and decision-making processes throughout the methodology enhances transparency and replicability, contributing to more rigorous practices in applied GIS research for waste management.
Future research should address several directions to build on this work. First, longitudinal studies tracking illegal TWD formation and elimination over time would provide insights into temporal dynamics and enable evaluation of intervention effectiveness. Such studies could identify seasonal patterns, growth rates of illegal sites, and factors influencing site persistence or abandonment. Second, integration of socioeconomic data with spatial analysis would enable more sophisticated modeling of illegal TWD risk factors, potentially using machine learning approaches to predict high-risk locations for preventive interventions. Third, comparative studies across multiple sub-districts or cities would enable development of generalized models and identification of context-specific vs. universal factors influencing illegal disposal. Fourth, detailed economic analysis incorporating cost-benefit assessment, lifecycle costing, and financial feasibility analysis would strengthen the practical applicability of recommended solutions. Fifth, community perception and behavioral studies would complement the spatial-technical analysis with social dimensions, examining factors influencing resident disposal behavior and acceptance of waste management facilities. Finally, integration of remote sensing technologies with ground surveys could enhance efficiency and coverage of illegal TWD identification, particularly for large-scale applications. These future research directions would contribute to more comprehensive, effective, and evidence-based approaches to urban waste management challenges in Indonesian cities and beyond.
CONCLUSION
The identification results show 19 illegal TWD in Sukarame Sub-district, Bandar Lampung City. The highest number of illegal TWD is found in Korpri Raya, Sukarame, and Way Dadi Baru villages with 5 illegal TWD each, while the lowest distribution is in Sukarame Baru village with 1 illegal TWD. Other illegal TWD are located in Way Dadi village with 3 TWD. Korpri Jaya village has no illegal TWD.
The existence of illegal TWD in Sukarame Sub-district is influenced by several factors including land use type, population density, waste service provision by the government, and road access. The inadequate number of legal TWD facilities (only 1 unit serving the entire sub-district) is a primary contributing factor to the emergence of illegal waste disposal sites.
Solutions for handling illegal TWD are implemented through two approaches: (1) diversion to legal TWD, which requires an additional 20 units of motorized carts to improve waste collection and transportation services, and (2) recommendation of new TWD locations with a service radius of 500 m, amounting to 9 units distributed across 6 villages. The spatial analysis demonstrates that the 500 m service radius provides optimal coverage for the 1771 ha area of Sukarame Sub-district, ensuring adequate waste management services throughout the region.
This research demonstrates the effectiveness of GIS-based spatial analysis in identifying illegal waste disposal sites and formulating evidence-based solutions for waste management challenges in urban areas. The methodology developed in this study can be applied to other sub-districts and cities facing similar waste management problems.
Limitations
Several limitations of this study should be acknowledged. First, the field survey was conducted at a single point in time and may not capture temporal variations in waste generation patterns or seasonal fluctuations in illegal TWD formation and size. Second, waste volume measurements were conducted manually using geometric approximations, which may introduce measurement errors compared to more advanced volumetric assessment technologies. Third, the analysis did not include detailed economic feasibility assessment of the proposed solutions, including capital investment requirements, operational costs, and cost-benefit analysis of the infrastructure expansion. Fourth, social acceptance factors and community behavioral aspects were not empirically evaluated through surveys or stakeholder consultations, though these factors are critical for successful implementation. Fifth, the study focused on spatial and technical aspects without detailed examination of institutional capacity and governance mechanisms required for sustainable waste management. Finally, the methodology was applied to a single sub-district, and while the approach is replicable, local contextual factors may influence its applicability in different urban settings. Future research should address these limitations through longitudinal studies, automated measurement technologies, comprehensive economic analysis, community engagement studies, and comparative multi-site investigations to develop more generalized frameworks for illegal waste management in Indonesian cities.
Recommendations
Based on the research findings, the following recommendations are proposed. Immediate action should focus on implementing the recommended solution by establishing 9 new TWD locations with a 500 m service radius to provide adequate waste collection coverage throughout Sukarame Sub-district. Infrastructure improvement is needed through the procurement and deployment of 20 additional motorized carts to support waste collection and transportation services, enabling diversion of waste from illegal TWD to legal facilities. Enforcement and monitoring measures should be strengthened to prevent the establishment of new illegal TWD and to monitor existing illegal sites for cleanup and remediation. Public awareness campaigns are recommended to educate residents about proper waste disposal practices and the importance of using legal TWD facilities. A regular monitoring system using GIS technology should be established to track changes in TWD distribution and identify emerging illegal disposal sites. Policy development based on spatial analysis results is advised, including zoning regulations and service area requirements for TWD facilities. Finally, the methodology developed in this research can be applied to other sub-districts in Bandar Lampung City and other cities facing similar waste management challenges. The implementation of these recommendations will contribute to improved waste management practices, reduced environmental pollution, and enhanced public health in Sukarame Sub-district and potentially other urban areas in Indonesia.